Claude Code statusline
OpenUsage can render a one-line status bar for Claude Code, shown at the bottom of the editor. It summarizes the model, your session and today's cost, the active 5-hour billing block, the burn rate, and how full the context window is — all from your local conversation logs, with no network call by default.
🤖 Opus 4.8 | 💰 $12.40 sess / $6.79 today / $3.40 block (2h41m left) | 🔥 $1.20/hr | 🕔 5h 15% | 🧠 96k (48%)
Costs are API-equivalent estimates derived from your local logs, not your subscription charge. The session figure is the whole conversation's lifetime; "today" is across all your Claude Code sessions since local midnight.
Install
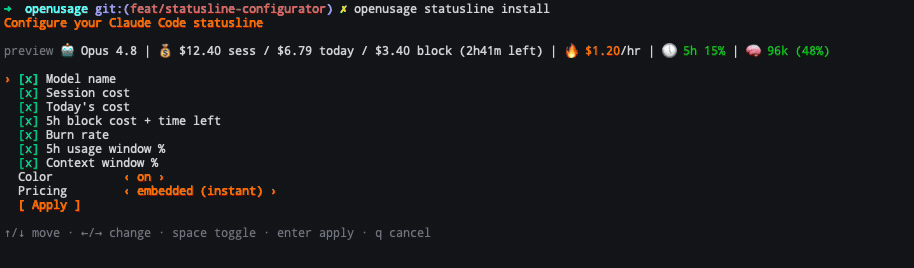
The fastest path is the interactive installer. On a terminal, run:
openusage statusline install
This opens a one-screen, live-preview configurator (the same style as openusage tmux install). Toggle which segments you want, flip the options, and watch the preview update; press enter on Apply to write it into ~/.claude/settings.json (your previous settings are backed up to settings.json.bak).
Then restart Claude Code (or open a new session) so it re-reads settings.json.
What each segment shows
| Segment | Example | Notes |
|---|---|---|
| Model name | 🤖 Opus 4.8 | From the session Claude Code pipes in. |
| Session cost | $12.40 sess | The whole conversation's API-equivalent cost. |
| Today's cost | $6.79 today | All Claude Code spend since local midnight. |
| 5h block | $3.40 block (2h41m left) | The active 5-hour billing block and time remaining. |
| Burn rate | 🔥 $1.20/hr | Spend rate for the active block. |
| 5h usage window | 🕔 5h 15% | Rate-limit utilization of the rolling 5-hour window. This isn't in the local logs — it's read from the running OpenUsage daemon over the local socket (no network), and is shown only when the daemon is running and has it. |
| Context % | 🧠 96k (48%) | Tokens in the context window vs. the model's limit; turns yellow then red as it fills. |
The 5h usage window segment needs the telemetry daemon (openusage telemetry daemon install), which is what polls Claude Code's rate-limit quota. The value is cached locally for ~30s (a single small file shared across sessions), so renders stay instant and the daemon isn't hit on every keystroke. The other segments work purely from local logs with no daemon.
Customize
Everything the configurator sets can also be passed as flags — useful for scripting or for editing the command in settings.json directly.
# Only show today's cost and the context gauge:
openusage statusline install --segments today,context

# Drop color (e.g. for a terminal that mishandles ANSI), keep all segments:
openusage statusline install --color=false

# Fetch live pricing instead of the embedded table (slightly slower):
openusage statusline install --offline=false
Passing any of --segments, --color, --offline, or --mode makes the install non-interactive and bakes those choices into the installed command.
Other flags:
--context-medium <pct>/--context-high <pct>— thresholds where the context gauge turns yellow / red (defaults: 50 / 80).--mode calculate|display|auto—calculate(default) recomputes cost from tokens and local pricing;displayuses the cost Claude Code reports;autoprefers logged cost and falls back to calculation.
Manual configuration
If you'd rather edit ~/.claude/settings.json by hand, add a statusLine block. The installed command carries your options as flags:
{
  "statusLine": {
    "type": "command",
    "command": "openusage statusline --segments today,context",
    "padding": 0
  }
}
A bare openusage statusline (no flags) shows every segment in full color.
Uninstall
openusage statusline uninstall
This removes only the OpenUsage statusLine block (it leaves a third-party statusline alone) and backs up the file first.
See also
- tmux integration — the same usage data in your tmux status bar.
- Headless reports —
daily/weekly/monthly/session/blocksfor scripts and CI.